In truth, and despite its loyal fans, Excel is simply not cut out to process and interact with the networked data world that is on the cusp of accelerating. When shown modern analytical and networked software, you would need help finding a treasury or procurement person to argue a case for Excel. Perhaps a few diehards will hold out, but the old quip about denial is not a river in Egypt comes to mind.
Today, Excel is widely used by companies when it comes to managing, optimizing, and analyzing their supply chain, spend, and payment terms data and supplier information. Financial analysts and procurement within buying organizations use Excel to address a range of standard supply chain management challenges:
- Which suppliers and payment terms to choose?
- How to measure the risk of supply chain disruptions?
- Where is concentration in spending in terms of geography, industry, or commodities?
Although the first Excel version was released in 1985, surprisingly, the application is still used by companies to manage some of these essential questions after almost 40 years.
In the meantime, we got smartwatches that can measure everything from our pulse to oxygen level, AI-powered software that automatically writes articles like this one, and mobile phones that even run Excel.
Microsoft Excel is a versatile spreadsheet software program, which became a popular tool with millions of active users, and for a good reason. It’s flexible and often quick to get started for simple calculations, filterings, and charts.
Nevertheless, with big data as the new normal and machine learning changing everyday life, Excel is showing increasingly essential shortcomings.
Spreadsheets can only be made out of a maximum of 1,048,576 rows, and charts included in the application can contain only up to 255 data series. The list goes on regarding limitations, from unwieldiness, security issues, and inability to perform analytics holding it back.
In 2012, an Excel miscalculation cost JPMorgan Chase $6.2 million after an employee added cells instead of averaging them. Two years later, Canadian-based electric power generatorTrans Alta, lost $24 million in a contract purchase when a copy-paste error in Excel accidentally increased purchase prices, wiping out 10% of their profits for the year. And more recently, end of 2020, the UK-based media outlet, The Guardian, reported that almost 16,000 people infected with the coronavirus were missing in the country’s public health infection counts and contact tracing efforts. The reason? Excel was used as a replacement for a “real database”, and it ran out of space.
Spreadsheets can look similar to a database table for non-database users; however, Excel is not a database. Below are some key challenges when using Excel as a data analytics tool for your financial supply chain. It isn’t suitable for internal and external collaboration.
- It shouldn't be used for sensitive data
- It doesn’t connect data tables automatically
- It does not give you actionable data
- It provides limited data analytics
Let’s go deeper into these challenges using Excel.
It isn’t suitable for internal and external collaboration.
As we all experienced, updating information in an Excel file requires that all changes are saved at an individual workstation. Multiple users can't make simultaneous edits. Here’s a familiar scenario: you enter your data into a shared spreadsheet. Then, you try to save it and receive a notice that the workbook is currently in use. So you decide to keep a copy of the file, telling yourself that you’ll go back and merge the data later. But we all know that never happens, and your team ends up with multiple spreadsheet copies.
This limitation can cause users to mistakenly work with outdated data, hinder real-time collaboration, and lack effective audit and history tracking. When working in a team, spreadsheets are passed from user to user for sequential updating, which is time-consuming, prone to error, and not secure in having multiple copies among users.
It shouldn't be used for sensitive data.
A “protected” spreadsheet cannot protect from extracting proprietary supplier and spend data. In addition, users are forced to share Excel files via emails saved on their notebooks.
It doesn’t connect data tables automatically.
With Excel, you cannot automatically carry data across related fields or from one spreadsheet to another. Everything is done manually, which is time-consuming and vulnerable to human error. A database allows instantly and automatically updating information across all related data tables.
It does not give you actionable data.
Excel sheets are passive, meaning you can only enter or query data. Unlike an advanced analytics system using a database as a data source, you cannot generate actions such as reminders when you need to negotiate payment terms to achieve opportunities in cash flow.
It provides limited data analytics.
We’ve already highlighted the challenges of Excel managing large amounts of data. Although users can sort, filter, and calculate data to a certain extent, Excel lacks more advanced data analytics offered by relational databases. Such databases focus on storing large amounts of data with integrity, allowing you to set up rules regarding your supplier and spend data.
In addition, finding information in Excel is limited to searching using Control+F and column filters. But with various users needing easy access to spend, supplier, and payment terms data, a modern, more advanced search experience is required.
Summarizing to a simple point.
As your data on spend and suppliers grows, it becomes increasingly complex, valuable, and meaningful. As a result, Excel spreadsheets are no longer good enough, you need a dedicated tool that helps you to manage, analyze and use your spend data.
A recent survey found that 43% of companies need to be made aware of the number of spreadsheets they use daily, and 60% of respondents acknowledged that they spent too much time manipulating data, relying on spreadsheets. (Source: FSN survey of UK companies)
Suppose you are among the 60%, excellent. In that case, you know that sooner or later, you will have to take the step - if you haven't already - to use a specific system to manage and analyze your supply chain data effectively and thus gain a competitive advantage.
When should you consider using a dedicated database and system for managing and analyzing your supply chain? Below are listed the cases in which you should consider it:
- You start to generate a volume of data that you find challenging to manage.
- You find it difficult and tedious to make decisions because you need the right data or you can't find the data you need.
- You want to collaborate internally and have other team members work with the same data to track results.
- You need specific interfaces and analytics to solve complicated tasks.
- You must enhance your dataset with additional information to gain more insight and become smarter when dealing with trading partners.
If you recognize your situation in at least one of these areas, it may be time to seek solutions and advice from experts in supply chain data management.
What is the alternative to Excel for your financial supply chain?
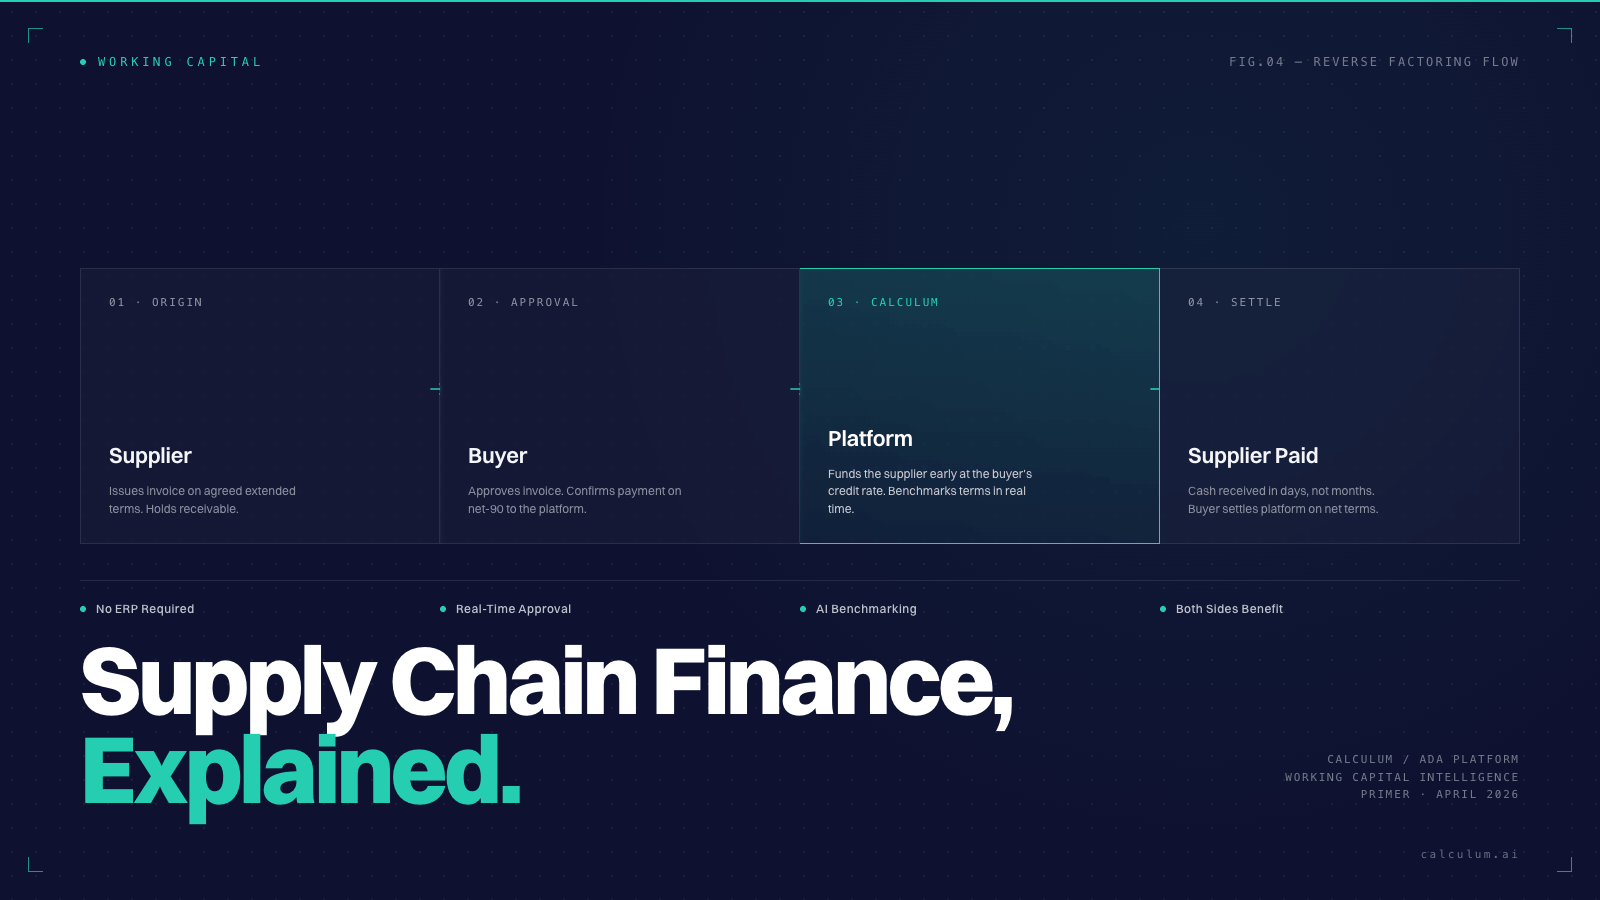
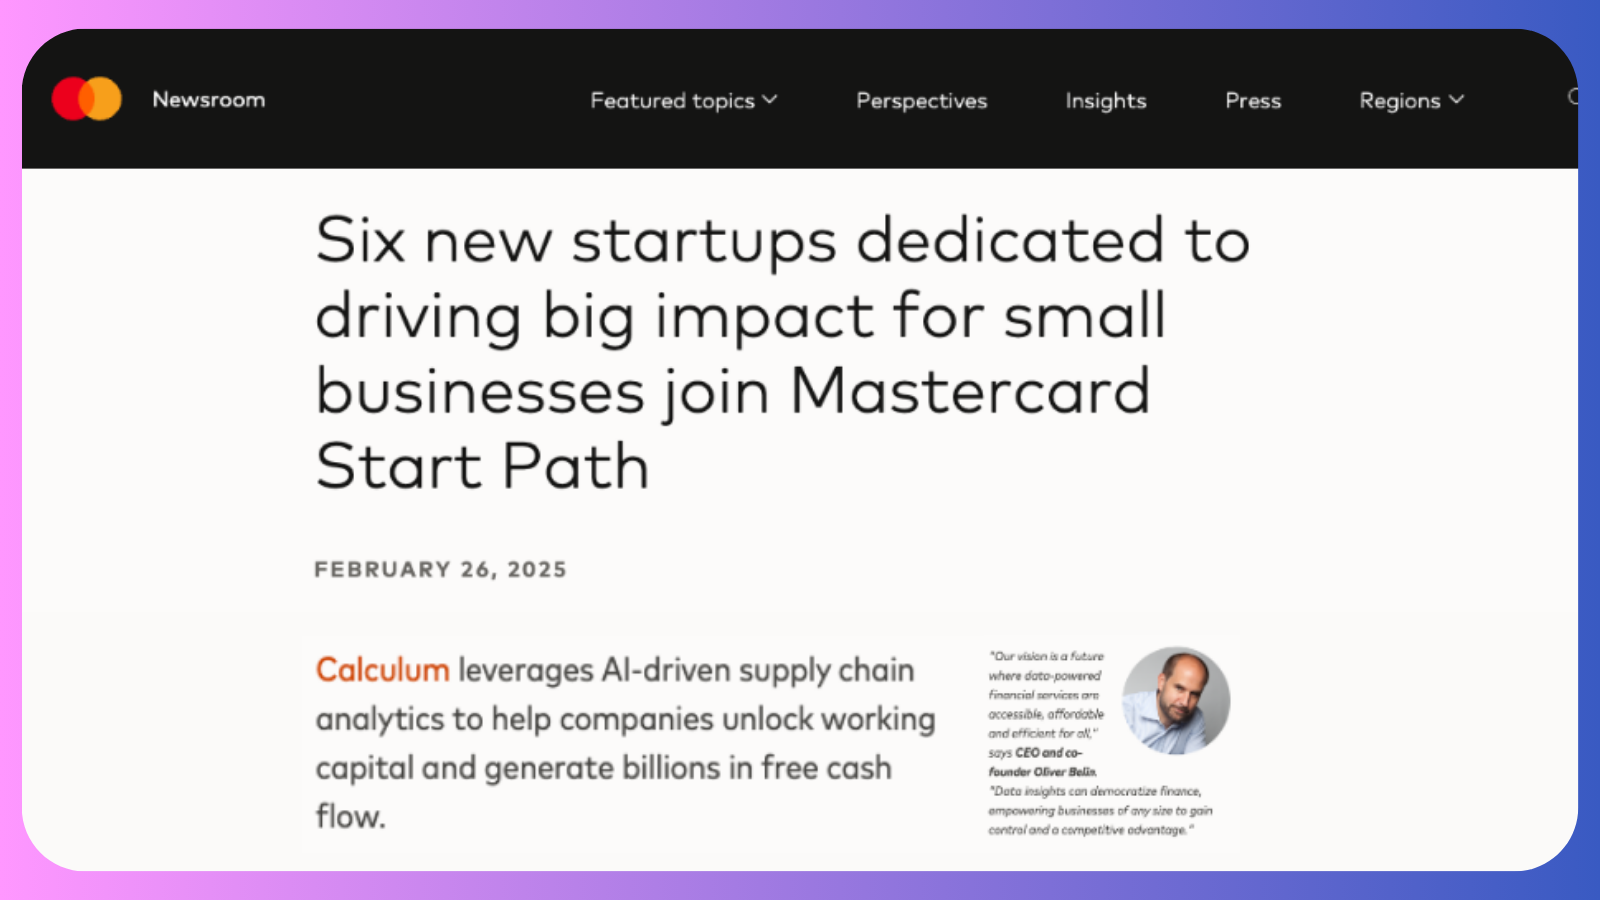
For large-scale, data-intensive opportunities requiring complex model logic, proper supply chain leaders in treasury and procurement use specialized data analytics tools leveraging AI. Miami-based Fintech company, Calculum.ai provides such an optimization tool called ADA. Easier to use than Excel and with all the power and flexibility of a custom-made solution, leveraging 1 million companies across the globe from hundreds of different industries and commodities.
The cloud-based Data-as-a-Service (DaaS) analytics engine uses numerous technological advances in statistical methods and AI to help companies of all sizes optimize their payment terms. It uses rules-based logic to collate, process, analyze, predict, and visualize large volumes of data from multiple internal and external sources. Ada layers different factors to predict and estimate payment terms between corporates and their suppliers and customers. It includes factors such as:
- Company size of the client and its trading parties
- Leverage of client and its trading parties
- Length of trading relationship
- Country and industry
- Company growth and market share
- Financial strength and credit risk scoring
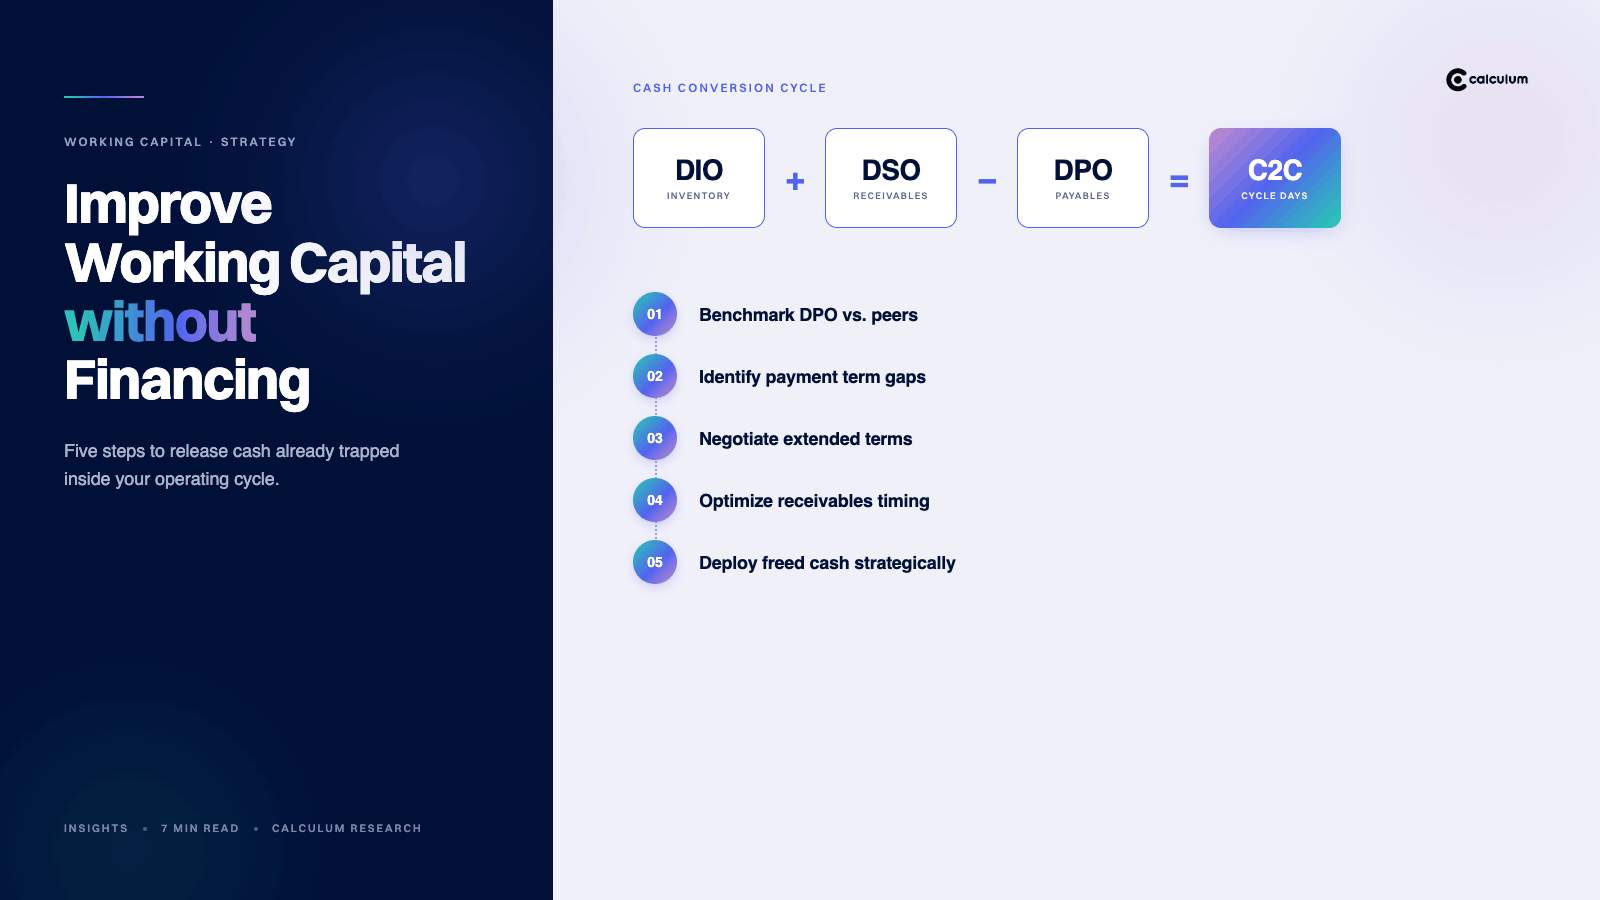
- Days Sale Outstanding (DSO), Days Payable Outstanding (DPO), and Cash Conversion Cycle (C2C)
- Payment behavior and payment discounts
In addition, besides these numerous data points on suppliers, the ADA Platform provides actionable insights by generating customized scripts to negotiate optimized terms using all the required arguments to achieve the planned results.
All data results, insights, and visualizations can be shared with other users in your organization. The actual collaboration capabilities between treasury and procurement allow leading organizations to become truly data-driven companies and all this in a controlled and secure way.
What’s Next?
The most challenging step away from Excel is culture. Most likely, many of your finance and supply chain management team have been using Excel for a significant portion of their careers. Not surprisingly, they may push back against your insistence that the industry-standard tool they’ve grown accustomed to needs to go.
If you’re interested in learning how to step away from Excel and build your database out of your existing spreadsheets to get intelligence on your suppliers and help you optimize your payment terms, thus generating free cash flow, we’ve got just the solution.
Do you have Excel spend files with your suppliers and need more data insights? Do you want to leverage your data and need help figuring out where to start? Contact us today, book a demo, and our experts will let you analyze your suppliers and give you the best options for improving your working capital.
.png)


.png)
.jpeg)
.png)