Back To All Resources
Articles
Payment terms optimization ROI model for CFOs
August 17, 2026
Read time:
9 min
August 17, 2026
Payment terms optimization is the process of analysing, benchmarking and renegotiating the timing of payments to suppliers and collections from customers. The goal is to release working capital without touching revenue, margin or capital structure, by moving terms toward what the market actually supports.
For CFOs this is one of the few levers that converts almost immediately. Cost reduction programmes take quarters to reach the cash flow statement; a renegotiated term reaches it on the next payment run.
Most enterprises negotiate from historical precedent, rarely testing terms against what comparable companies achieve. An ROI model turns that inherited position into a measurable gap and a defensible target.
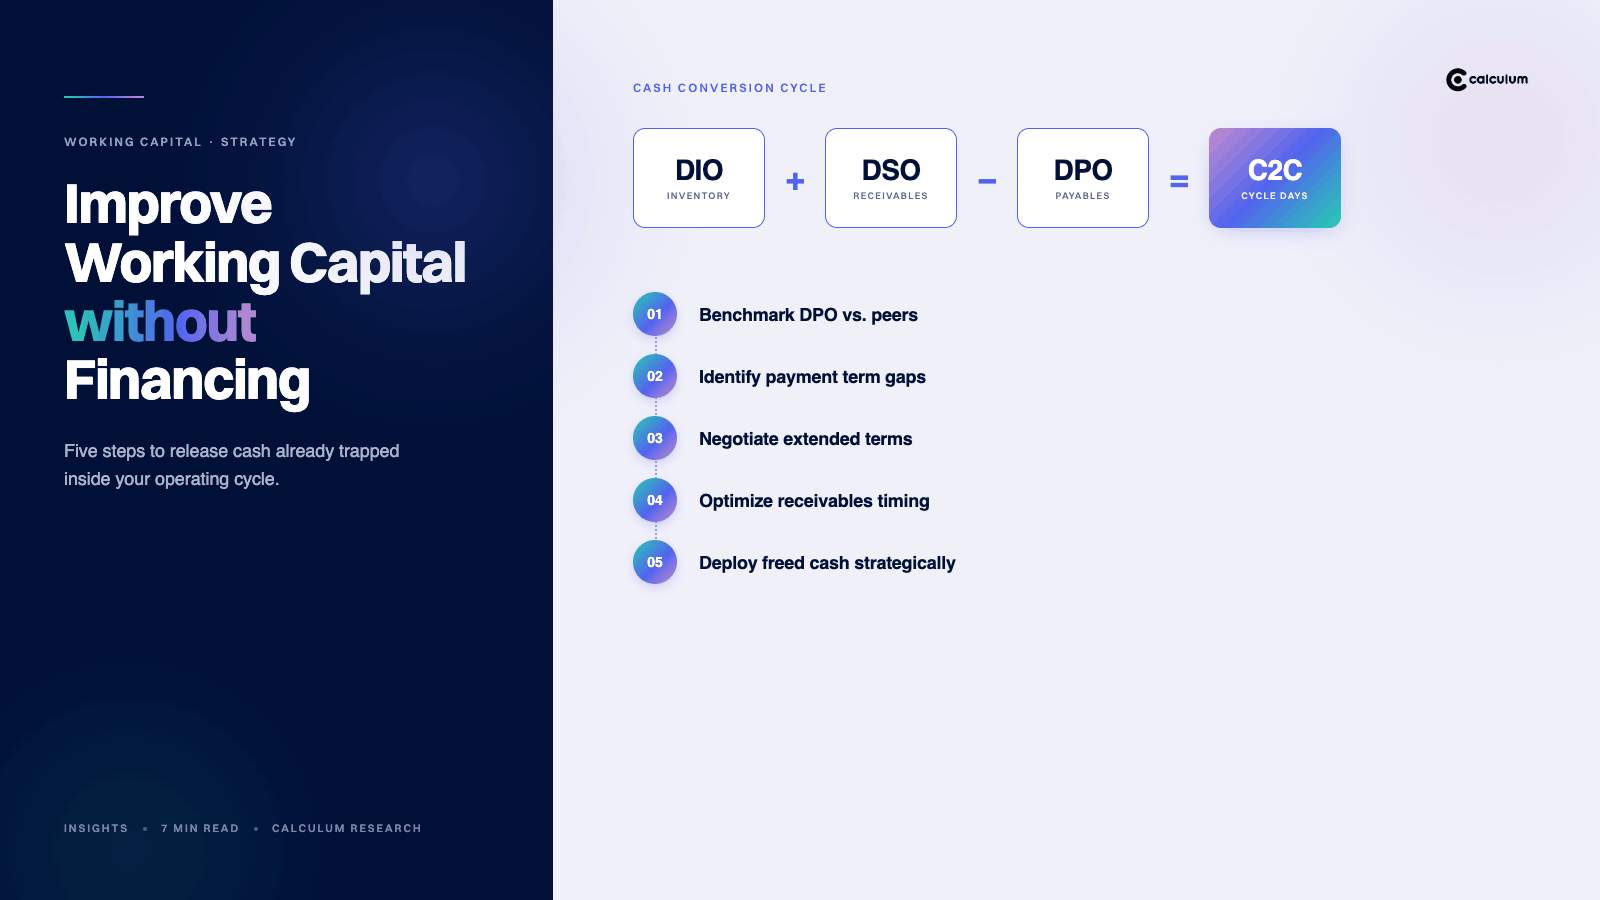
The cash conversion cycle measures the days between paying suppliers and collecting from customers. It has three components: Days Inventory Outstanding (DIO), Days Sales Outstanding (DSO) and Days Payable Outstanding (DPO). Payment terms directly influence two of the three, on the payables and receivables sides.
The formula is CCC = DIO + DSO minus DPO. A shorter cycle means cash returns faster, which improves liquidity and reduces financing needs.
Extending terms from net 30 to net 60 holds cash for an additional 30 days before suppliers are paid. Across a large payables base, even a single day can release millions, available for operations, debt reduction or investment with no external financing. The same principle runs in reverse on the receivables side, where collecting sooner compresses the cycle from the other end.
Multiply the terms gap by daily spend. On the payables side: (target payment days minus current payment days) multiplied by (annual COGS divided by 365). A company with 500 million USD in annual COGS closing a 20 day gap releases roughly 27.4 million USD.
Worked through: 20 multiplied by (500,000,000 divided by 365) is approximately 27.4 million USD, released through renegotiation alone. The receivables side uses (current collection days minus target collection days) multiplied by (annual sales divided by 365).
As a rule of thumb, a 30 day extension frees approximately 82 million USD per 1 billion USD of annual spend. A company with 5 billion USD of spend and a 30 day gap is looking at more than 400 million USD of potential liquidity.
For the receivables worked example and the three errors that most often inflate the figure, see how to calculate the working capital released by a payment terms change.
Build it on payment terms. DPO is a blended, company-level accounting ratio that averages thousands of different supplier terms into one lagging number, and it moves for reasons unrelated to the terms themselves. Calculum models contracted terms and actual payment days supplier by supplier, then reports the DPO effect as an outcome.
| Payment terms | DPO | |
|---|---|---|
| What it is | The commercial terms agreed with each supplier | A single company-level accounting ratio |
| Where it comes from | Contracts and actual payment dates | Balance sheet and P&L |
| What moves it | Negotiation | Spend mix, seasonality, one-off payables, and terms |
| What can be acted on | Every supplier line | Nothing directly |
A model built on DPO can show improvement while the underlying terms have not changed, because spend simply shifted toward suppliers already on longer terms. A model built on payment terms cannot, because every line traces to a contract and a payment date. One is the lever. The other is the readout.
The distinction is set out in full in payment terms vs DPO: what the difference means for your cash position.
Credible targets come from external reference points, not internal history. Internal benchmarking, comparing one business unit against another, says nothing about what the market supports. Calculum benchmarks terms against more than 7.5 million companies across 160+ countries and 120+ industries.
This is where most enterprises hit a wall. Without market-level data, teams negotiate from precedent or intuition rather than evidence of what is achievable. Effective benchmarking disaggregates:
Five steps: establish the baseline, set benchmark-based targets, calculate the cash release, value the working capital benefit, and model scenario variations. Each step produces the input the next one needs, which is what makes the resulting model auditable rather than assertive.
| Step | What it produces |
|---|---|
| 1. Establish the baseline | Contracted terms and actual payment days, supplier by supplier. The supplier-level position is the only one that can be negotiated. |
| 2. Set benchmark-based targets | What comparable companies achieve in the relevant sector and category. Terms at 45 days against a sector median of 65 give a 20 day target. |
| 3. Calculate the cash release | The terms gap multiplied by daily COGS on the payables side, and the collection gap multiplied by daily revenue on the receivables side. |
| 4. Value the benefit | Cash released multiplied by the cost of capital it displaces. At a WACC of 8%, releasing 27 million USD is worth roughly 2.16 million USD a year. |
| 5. Model scenarios | Conservative, moderate and aggressive cases, weighted by supplier segmentation to show expected rather than potential outcomes. |
Be realistic at step 2. Moving from the 25th to the 75th percentile rarely happens in one initiative, and a target that assumes it will not survive the negotiation.
Seven inputs support a full analysis: contracted payment terms, actual payment timing, annual spend or sales volume and category, credit rating, cost of debt and WACC, geographic location, and strategic importance. Calculum enriches trading partner profiles with over 20 data points.
Together these prioritise negotiations by combining high-spend categories with the largest terms gaps, weighted by how likely each partner is to accept a change.
Three drivers account for most underperformance: terms data fragmented across systems, procurement and treasury working to different KPIs, and no external benchmark to negotiate against. The third is the most common, because without market intelligence a negotiating position defaults to defensive.
Four disciplines separate initiatives that land from those that stall: aligning procurement and treasury KPIs, negotiating with market data rather than pressure, pairing extensions with financing where suppliers need it, and segmenting the trading partner base.
Benchmark, quantify, prioritise, design financing support, negotiate, then measure and govern. The sequence matters: each stage produces the input the next one needs, and skipping the benchmarking stage is what leaves most programmes negotiating without evidence.
Stage 4 sits deliberately after stages 1 to 3. Payment terms optimization determines what the terms should be; Supply Chain Finance determines how they are funded once set. One sets the destination, the other provides the vehicle. Extending sustainably before financing produces a larger and cheaper result.
AI processes trading partner data at a scale manual analysis cannot match. Calculum applies algorithms validated across millions of data points to match, analyse and segment supplier and customer data, achieving a 92% average matching rate, which allows analysis to begin without lengthy data preparation.
Applied to negotiation, the same analysis identifies which partners are most likely to accept a change, based on financial position, industry norms and relationship history. That turns a list of gaps into a prioritised sequence.
Four value drivers sit alongside the headline figure: avoided financing cost, return earned on cash retained, early payment discount capture, and any spread earned on a supplier financing programme. Together they usually add materially to the case a board sees.
Five metrics govern a payment terms initiative: the cash conversion cycle, payment terms by category, payment compliance rate, supplier participation in financing programmes, and the remaining benchmark gap. The compliance rate is the one most often overlooked, and the one where gains quietly leak away.
Norms vary widely. Manufacturing often operates on 30 to 90 day terms because of inventory cycles, while technology and software businesses carry less physical inventory and tend toward shorter ones. Retail faces seasonal variation. Geography matters as much as sector, with Northern Europe trending shorter than Southern Europe or parts of Asia.
General market averages therefore mislead. A manufacturing CFO comparing collection performance against a software business draws the wrong conclusion. Calculum segments benchmarks by industry, geography and company size so comparisons hold.
A CFO-ready model documents its assumptions, presents conservative, moderate and aggressive scenarios, names what could cause underperformance, shows when cash actually lands, and explains how progress will be governed. It connects the terms change to the balance sheet and cash flow statement rather than reporting liquidity in isolation.
Start with benchmark-based targets rather than historical performance, align procurement and treasury on shared working capital objectives, and track improvement supplier by supplier against the modelled target. The opportunity is rarely the constraint. Visibility into what the market supports usually is.
Acting on it requires external benchmarks, cross-functional alignment and trading partner level data that most enterprises do not hold internally. Calculum provides the benchmarking data and analytical insight that turn the opportunity from theoretical into measured.
On the payables side the formula is (target payment days minus current payment days) multiplied by (annual COGS divided by 365). Improving terms by 15 days on 400 million USD of COGS releases approximately 16.4 million USD. The receivables side uses the gap between current and target collection days multiplied by daily revenue.
Payment terms. DPO is a blended company-level ratio that can move without any change to the underlying terms, usually because spend shifted between suppliers. Payment terms are the commercial terms agreed with each supplier and the actual days taken to pay. The terms are the lever; DPO is the readout.
Optimize first where terms can be extended sustainably, then use financing to support them. Payment terms optimization determines what the terms should be. Supply Chain Finance determines how those terms are funded efficiently once set. A financing programme built before terms have been benchmarked tends to lock in an unexamined starting position.
Use external benchmarks from the same sector and region rather than internal historical data. Calculum benchmarks against more than 7.5 million companies to identify achievable targets. The sector median is a reasonable first milestone, with further improvement pursued through supplier segmentation.
Faster than most working capital levers. Unlike cost reduction programmes that take quarters, payment terms improvements convert to cash almost immediately after renegotiation. Timing depends on contract renewal cycles, so many organisations see initial results in months rather than years.
.png)